Clean Max Enviro Energy IPO Review 2026: Detailed Analysis and Valuation
India’s renewable energy sector is undergoing a structural shift, driven by corporate decarbonisation mandates, ESG compliance requirements and rising conventional energy costs. Corporate renewable procurement through long-term power purchase agreements (PPAs) has emerged as one of the fastest-growing segments within India’s power ecosystem.
Clean Max Enviro Energy Solutions Limited is entering the capital markets with a ₹3,100 crore initial public offering. Unlike speculative renewable offerings, this IPO warrants structured balance sheet analysis, valuation modelling and peer benchmarking.
This comprehensive review evaluates:
- IPO structure and pricing discipline
- Business model positioning
- Three-year financial performance
- Leverage and cash flow profile
- EV/EBITDA valuation
- Peer comparison
- Institutional-style investment outlook
IPO Structure and Pricing Overview
- IPO Open: 23 February 2026
- IPO Close: 25 February 2026
- Price Band: ₹1,000 – ₹1,053
- Lot Size: 14 shares
- Minimum Investment: ₹14,000
- Total Issue Size: ₹3,100 crore
- Fresh Issue: ₹1,200 crore
- Offer for Sale: ₹1,900 crore
- Listing: NSE & BSE
The issue has been structured in accordance with the disclosure and eligibility framework prescribed under the SEBI ICDR regulations governing public offerings in India.
A notable positive is that the IPO upper band of ₹1,053 aligns with the recent pre-IPO placement price. This indicates disciplined pricing rather than aggressive valuation expansion.
Business Model Overview
Clean Max operates as a corporate-focused renewable independent power producer (IPP). The company develops, owns and operates:
- Solar energy projects
- Wind assets
- Hybrid renewable systems
Its revenue model is built around long-term corporate PPAs rather than reliance on state electricity distribution companies. This structure offers:
- Improved receivable cycles
- Revenue visibility
- Reduced counterparty risk
However, the business remains capital-intensive and leverage-driven.
The long-term growth outlook for corporate renewable platforms is further supported by policy measures and capital allocation priorities outlined in the Union Budget 2026 renewable energy focus, which emphasises clean energy expansion and infrastructure development.
In addition, India’s renewable capacity expansion targets and policy roadmap are formally guided by the Ministry of New and Renewable Energy (MNRE), which sets the national framework for clean energy deployment.
Financial Performance Analysis (FY23–FY25)
(All figures in ₹ million)
Revenue Growth
| Year | Revenue |
|---|---|
| FY23 | 9,295.82 |
| FY24 | 13,898.37 |
| FY25 | 14,957.01 |
Revenue expanded 49% in FY24 before moderating to 7.6% in FY25, delivering a two-year CAGR of approximately 26.7%.
The revenue trend chart above highlights strong scale-up in FY24 followed by stabilisation in FY25, consistent with renewable project commissioning cycles.
EBITDA and Operating Efficiency
| Year | EBITDA |
|---|---|
| FY23 | 4,059.19 |
| FY24 | 7,415.73 |
| FY25 | 10,150.72 |
EBITDA margins improved significantly:
- FY23: 43.6%
- FY24: 53.3%
- FY25: 67.9%
This expansion reflects operating leverage benefits and asset stabilisation. Strong EBITDA growth is one of the IPO’s core strengths.
Profitability Trend
| Year | PAT |
|---|---|
| FY23 | (594.73) |
| FY24 | (376.43) |
| FY25 | 194.29 |
The company turned profitable in FY25 after two loss-making years. However, net margins remain thin due to high depreciation and finance costs.
This is typical of infrastructure platforms in expansion mode.
Balance Sheet and Leverage Analysis
Borrowings (FY25)
- Non-current borrowings: ₹71,268.37 million
- Current borrowings: ₹8,468.61 million
- Total Debt: ~₹79,737 million
Equity (FY25)
- Total Equity: ₹32,047.73 million
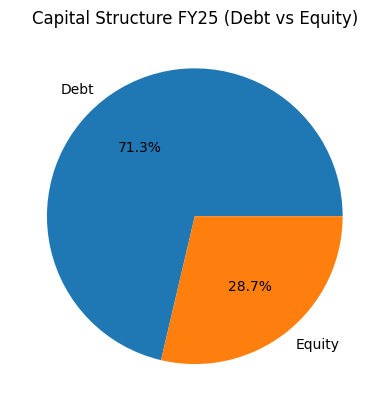
Capital Structure
Debt comprises approximately 71% of total capital employed, as illustrated in the capital structure pie chart above.
Leverage Ratios
- Debt-to-Equity: ~2.5x
- Debt/EBITDA: ~7.8x
Leverage remains elevated and represents the primary financial risk variable.
Cash Flow Strength
Operating Cash Flow (FY25)
Net cash from operating activities: ₹14,041.96 million
Operating cash flow significantly exceeds reported net profit, reflecting strong asset-level cash generation.
Investing Cash Flow
Net cash used in investing activities: (₹36,170.50 million)
This indicates heavy capital expenditure and aggressive capacity expansion.
Clean Max is clearly in an asset build-out phase.
Valuation Analysis
EPS and P/E
- FY25 Basic EPS: ₹2.88
- IPO Upper Price: ₹1,053
- Implied P/E: ~365x
The P/E appears elevated. However, this metric is less relevant for renewable infrastructure platforms in early profitability stages.
Enterprise Value Framework
Pre-offer shares: 102,833,720
Estimated Market Capitalisation at ₹1,053: ~₹108,300 million
Estimated Net Debt: ~₹76,450 million
Enterprise Value: ~₹184,750 million
EV/EBITDA
EV/EBITDA ≈ 18.2x
EV/EBITDA is the most appropriate valuation lens for asset-heavy renewable businesses.
At approximately 18x, the IPO appears reasonably valued relative to sector benchmarks.
Peer Comparison Analysis
Clean Max’s closest comparables include:
- Adani Green Energy
- Tata Power (renewables exposure)
- NTPC Green
Since Clean Max is leverage-driven, EV/EBITDA provides the most meaningful comparison metric.
Financial Comparison Snapshot (FY25 Basis for Clean Max)
| Metric | Clean Max | Adani Green* | Tata Power (Renewables Focus)* |
|---|---|---|---|
| Business Model | Corporate PPA Renewable IPP | Utility-scale + hybrid | Integrated utility + renewables |
| Revenue Growth | Moderate | Historically high | Stable |
| EBITDA Margin | ~68% | ~80%+ | Lower blended margin |
| PAT Trend | Turned profitable FY25 | Profitable | Profitable |
| Debt to Equity | ~2.5x | High leverage | Moderate |
| Debt/EBITDA | ~7.8x | Elevated | Lower than pure IPPs |
| EV/EBITDA | ~18.2x | Typically 18–25x | Lower blended multiple |
*Peer multiples fluctuate with market pricing.
Interpretation
- Clean Max’s valuation sits in the lower-to-mid range of renewable infrastructure multiples.
- EBITDA margins are strong, though slightly below some pure-play leaders.
- Leverage remains elevated compared to integrated utilities.
Valuation is not aggressive, but balance sheet strength will determine long-term rerating potential.
Clean Max IPO Valuation Summary
| Valuation Metric | Value |
|---|---|
| IPO Upper Price | ₹1,053 |
| FY25 Revenue | ₹14,957 million |
| FY25 EBITDA | ₹10,150 million |
| FY25 PAT | ₹194 million |
| FY25 Basic EPS | ₹2.88 |
| Implied P/E | ~365x |
| Total Debt (FY25) | ₹79,737 million |
| Net Debt (Approx.) | ₹76,450 million |
| Market Capitalisation | ~₹108,300 million |
| Enterprise Value | ~₹184,750 million |
| EV/EBITDA | ~18.2x |
| Debt to Equity | ~2.5x |
| Debt/EBITDA | ~7.8x |
Investment Outlook
For Listing Gains
Moderate probability. Large issue size and infrastructure profile limit potential for extreme listing premiums. Disciplined pricing reduces downside risk. Investors should also understand why stock market volatility impacts IPO performance, especially in capital-intensive sectors like renewable infrastructure.
In addition, broader FII selling trends in Indian markets can further influence short-term listing performance and liquidity conditions.
For Long-Term Investors
Suitable for investors who:
- Understand infrastructure capital structures
- Are comfortable with leverage exposure
- Believe in corporate renewable energy expansion
Not ideal for conservative investors prioritising low debt and high return-on-equity models.
From a portfolio allocation perspective, investors should evaluate such offerings within the broader landscape of long-term capital deployment strategies. For those comparing various long-term investment options in India, infrastructure-led IPOs like Clean Max present a differentiated risk-return profile driven by stable cash flows and contractual revenue visibility, albeit with higher leverage exposure than traditional equity or fixed-income instruments.
Final Verdict
Clean Max Enviro Energy represents a structurally relevant corporate renewable platform with strong EBITDA growth and improving operational efficiency.
At approximately 18x EV/EBITDA, the IPO appears reasonably valued relative to sector peers. However, elevated leverage remains the central risk variable.
Future rerating potential depends on:
- Post-IPO debt reduction
- Sustained EBITDA growth
- Disciplined capital allocation
- Improvement in return on capital
This IPO represents a balanced risk-reward infrastructure growth opportunity rather than a deep-value investment.
FAQs
1. What is the price band of Clean Max Enviro Energy IPO?
The Clean Max IPO price band is ₹1,000 to ₹1,053 per share. The upper band matches the company’s pre-IPO placement price.
2. What is the lot size and minimum investment for Clean Max IPO?
The lot size is 14 shares. At the upper price band of ₹1,053, the minimum investment required is ₹14,742. At the lower band of ₹1,000, the minimum investment is ₹14,000.
3. What is the total issue size of Clean Max IPO?
The total issue size is ₹3,100 crore, comprising a fresh issue of ₹1,200 crore and an offer for sale (OFS) of ₹1,900 crore.
4. Is Clean Max IPO fairly priced?
The IPO upper band of ₹1,053 is aligned with the recent pre-IPO placement price, indicating relatively disciplined pricing. Final valuation attractiveness depends on post-IPO debt levels and earnings visibility.
5. Should long-term investors apply for Clean Max IPO?
Long-term investors who believe in India’s renewable energy growth and are comfortable with infrastructure business models and moderate leverage may consider the IPO. Conservative investors should evaluate debt and return ratios carefully.
6. What are the key risks in Clean Max IPO?
Major risks include:
- Capital-intensive expansion
- Debt sensitivity
- Regulatory changes in renewable policies
- Execution delays in project commissioning
Disclaimer
The information provided in this article is for educational and informational purposes only and should not be considered as financial or investment advice. Please consult a certified financial advisor before investing.